Profiles & Liquidity
Market Dynamics Pro offers a variety of methods for analyzing liquidity. Each method is documented in detail below:
Prime Blocks
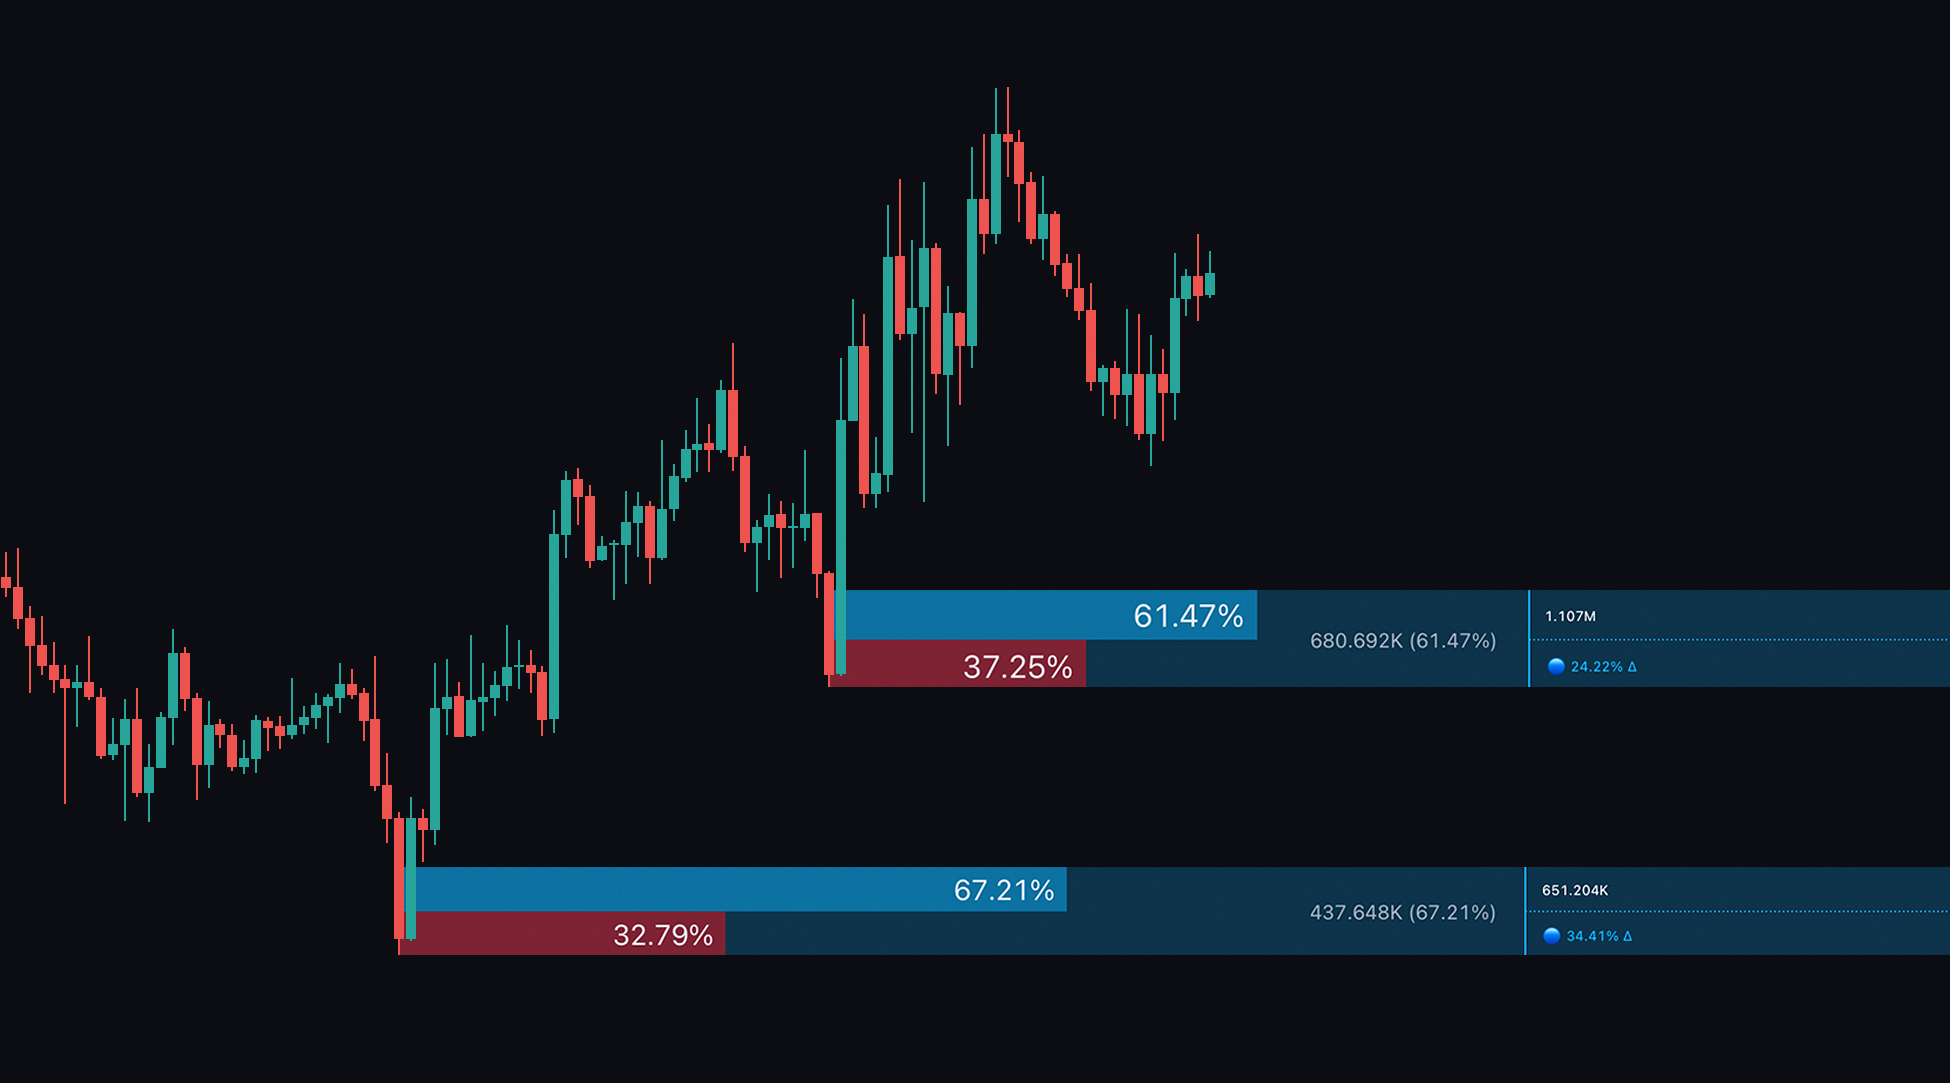
The Prime Blocks are a carefully designed bespoke tool to identify areas in the market with liquidity allowing more accurate identifcation of potential bounces or reversals in the market.
The blocks plot blocks based on significant market structure shifts & provide the following data points.
- Volume Data: Each block displays the bull and bear volume as a percentage of total volume, indicating the strength of buying or selling pressure in that region.
- Gray Text: Displays the volume specific to the order block type:
- For bearish blocks, it displays only the bear volume within the block as a percentage of the total OB volume.
- For bullish blocks, it displays only the bull volume within the block as a percentage of the total OB volume.
One of the key edges provided by the blocks are the volume deltas. Delta simply means difference and hence this shows the difference between buyer and seller volume. This gives massive insights into who is in control of the market.
 |
|---|
| Prime Blocks |
Delta Indicator: A color-coded circle represents the volume delta:
- 🔴 Red: Strong negative delta (-100% to -20%).
- 🟡 Yellow: Neutral delta (-10% to 10%).
- 🔵 Blue: Strong positive delta (20% to 100%).
For a full explanation of Prime Zones, watch the video below:
Users are also able to adjust the number of displayed blocks via the input setting and modify where zones are drawn from e.g. Wicks or bodies.
Liquidity Zones
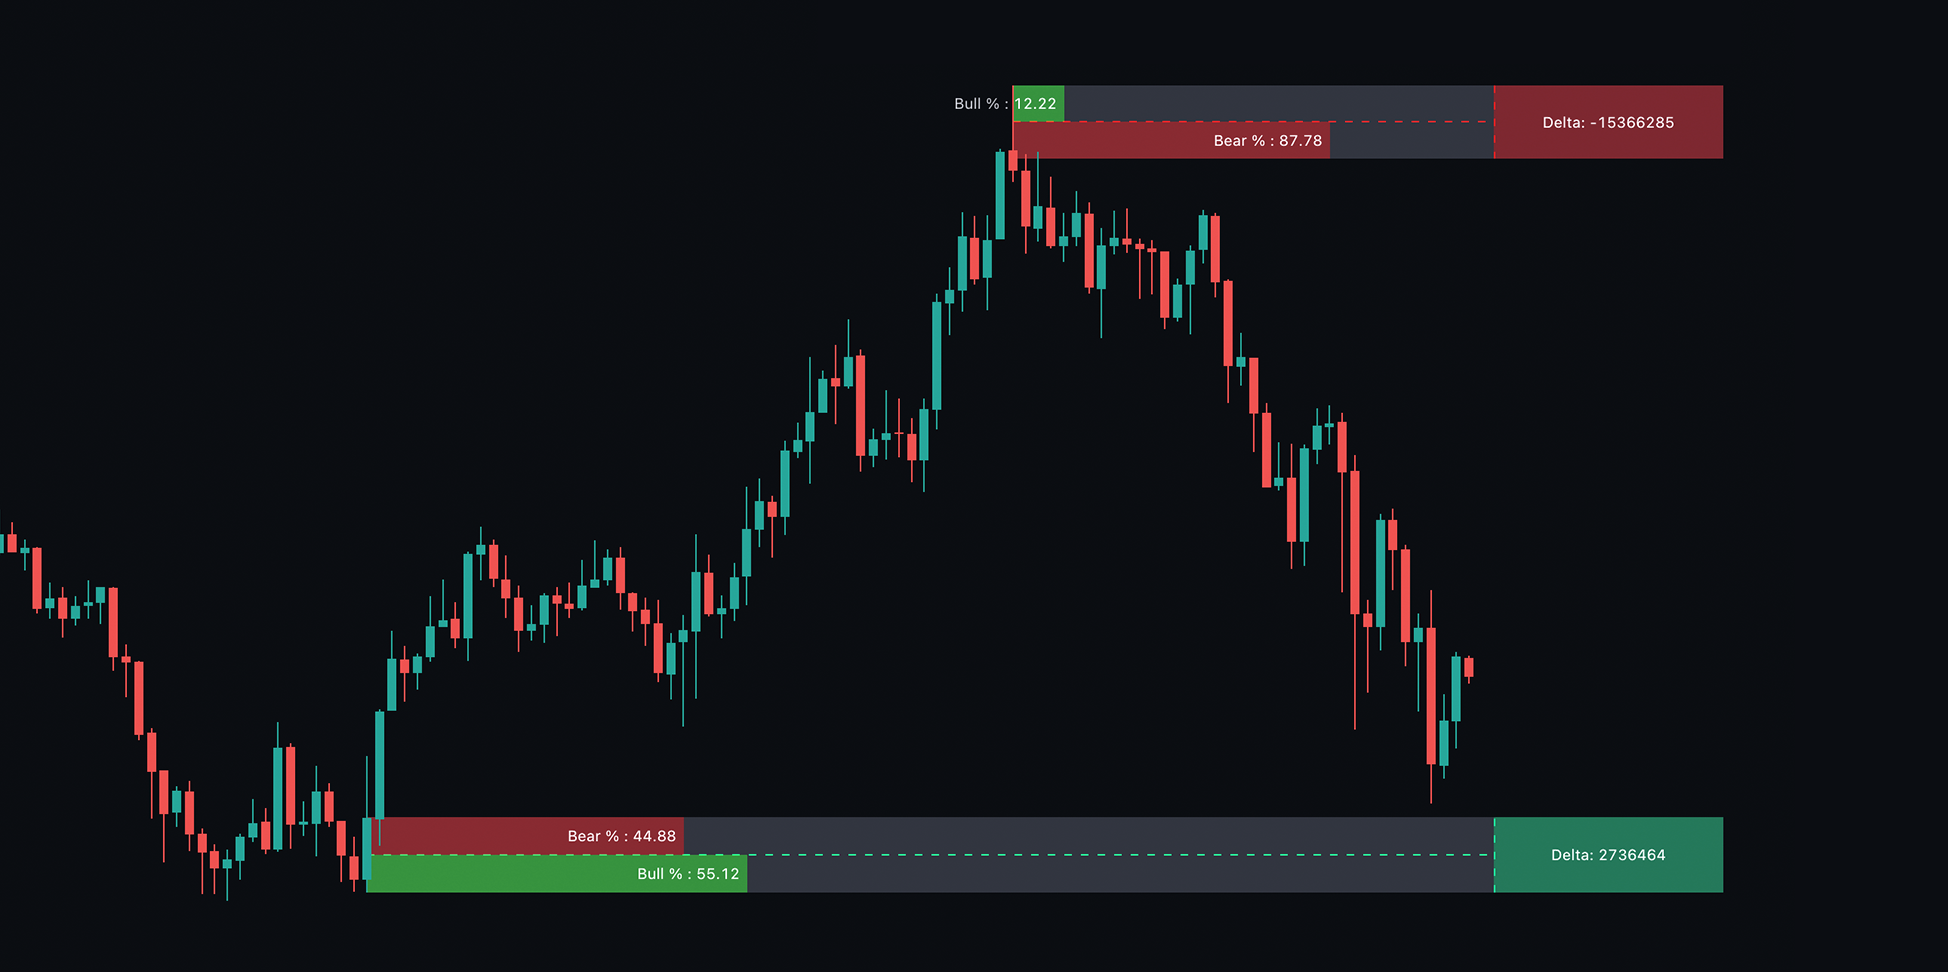
Liquidity Zones indicate distinct levels where significant liquidity may be present in a market, suggesting large quantities of orders at these levels. This cutting-edge detection method shows the amount of bullish or bearish volume that contributed to creating each zone. A percentage indicates the ratio, and a delta value shows the difference between bullish and bearish volume, providing valuable insights into price action.
 |
|---|
| Liquidity Zones |
Traders may use these zones as potential take profit (TP) or stop loss (SL) levels, as well as classical support or resistance levels. If a liquidity zone is above the current price action, it contains sell-side liquidity; if below, it contains buy-side liquidity.
For a full explanation of liquidity zones, watch the video below:
Volume Profile
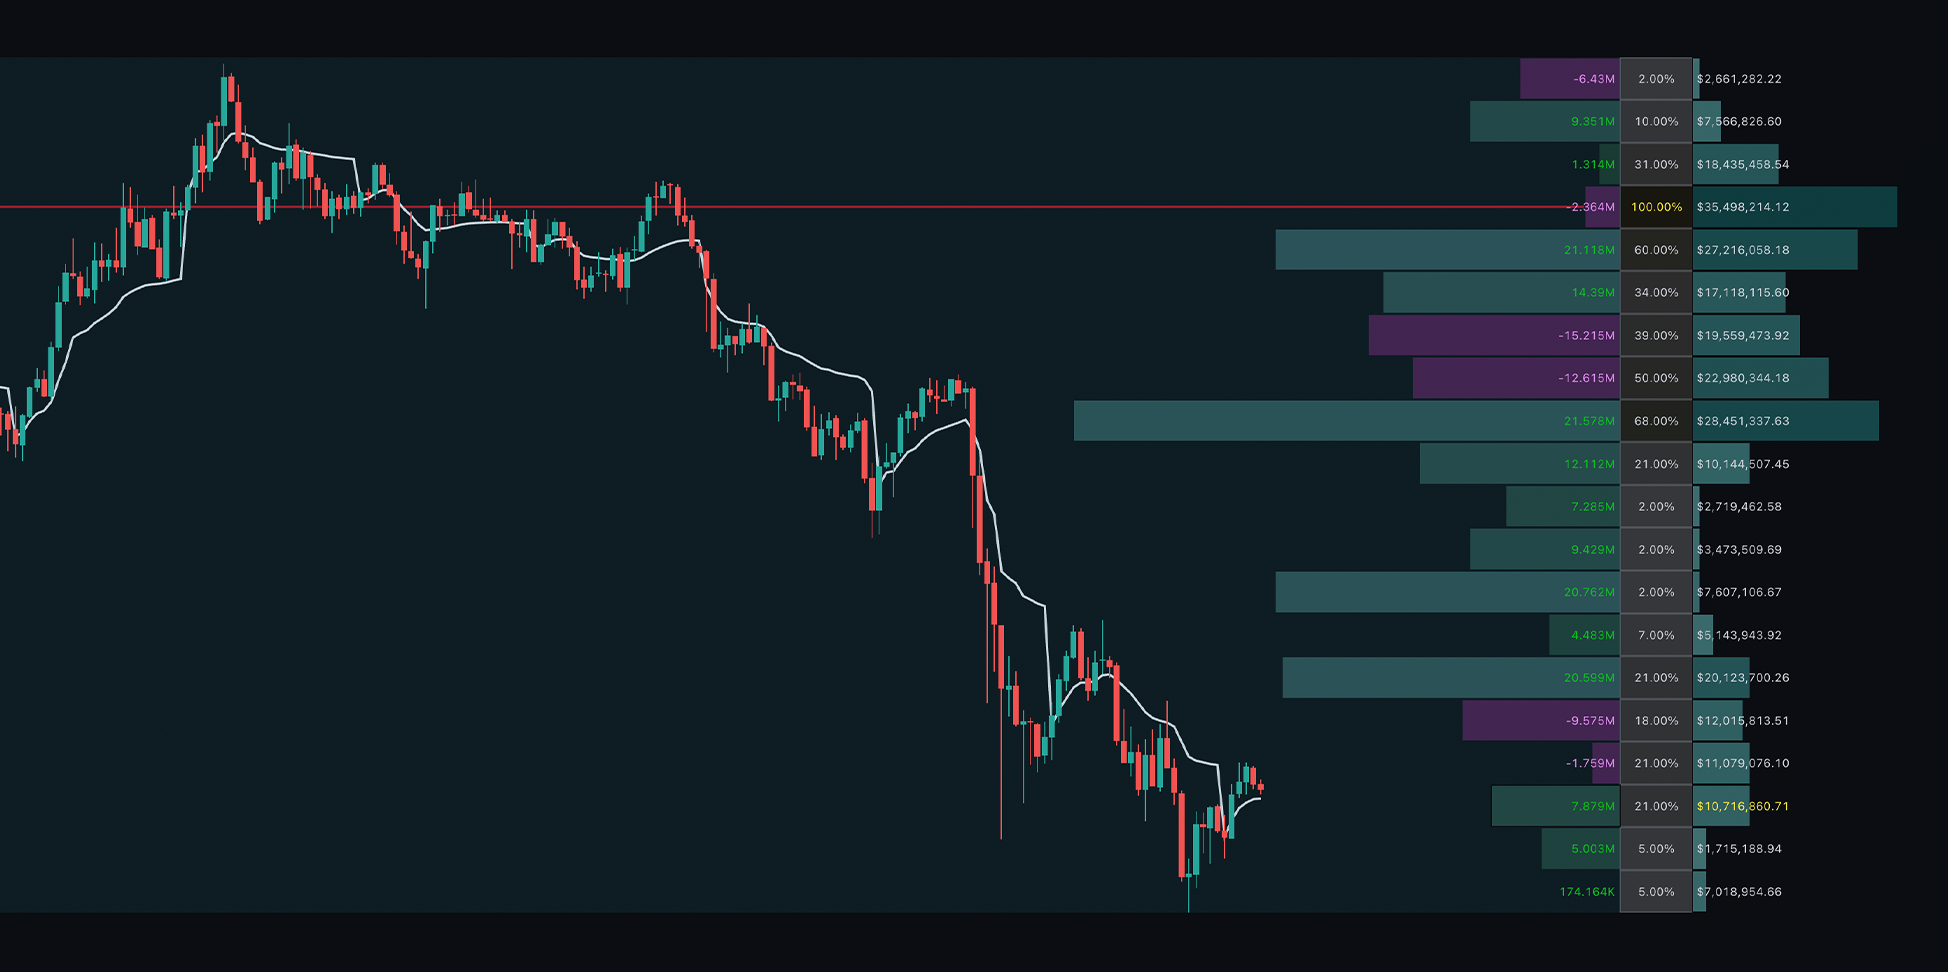
The Volume Profile designed by ChartPrime elevates volume analysis. The left side displays the base volume, the right shows the quote value, and the center indicates the strength of that level as a simple percentage. Users can toggle the money flow Point of Control (POC) along with other key data points, which typically represent major support or resistance areas and high liquidity zones. A box highlights the length and depth of the profile, providing a clear indication of scanned volumes.
There POCs selectable are:
- Delta + Which shows the area in the market that had the highest difference between bullish and bearish volume.
- Delta - Which had the largest sell side volume
- Money Flow which shows the highest point of money flowing in or out of market
- Volume + where the highest overall volume was found
- Level % which shows the highest rated level in the market
This moves the center line to the area of the market most interesting to the trader and allows for deeper insights into volume and price action.
 |
|---|
| Volume Profile analyzing chart volume |
Enabling only the money flow POC while disabling the profile will display a single clean zone on your chart, indicating major trading activity.
When using volume profiles, it’s beneficial to look for peaks in volume activity. These peaks can reveal significant support or resistance areas in the market. Additionally, low activity zones may indicate that price won’t respect support/resistance in those areas, essentially becoming a “no man’s land.” Exercise caution when trading in low-volume regions.
To learn how to analyze the Volume Profile by ChartPrime, watch the tutorial below:
Premium & Discount Zones
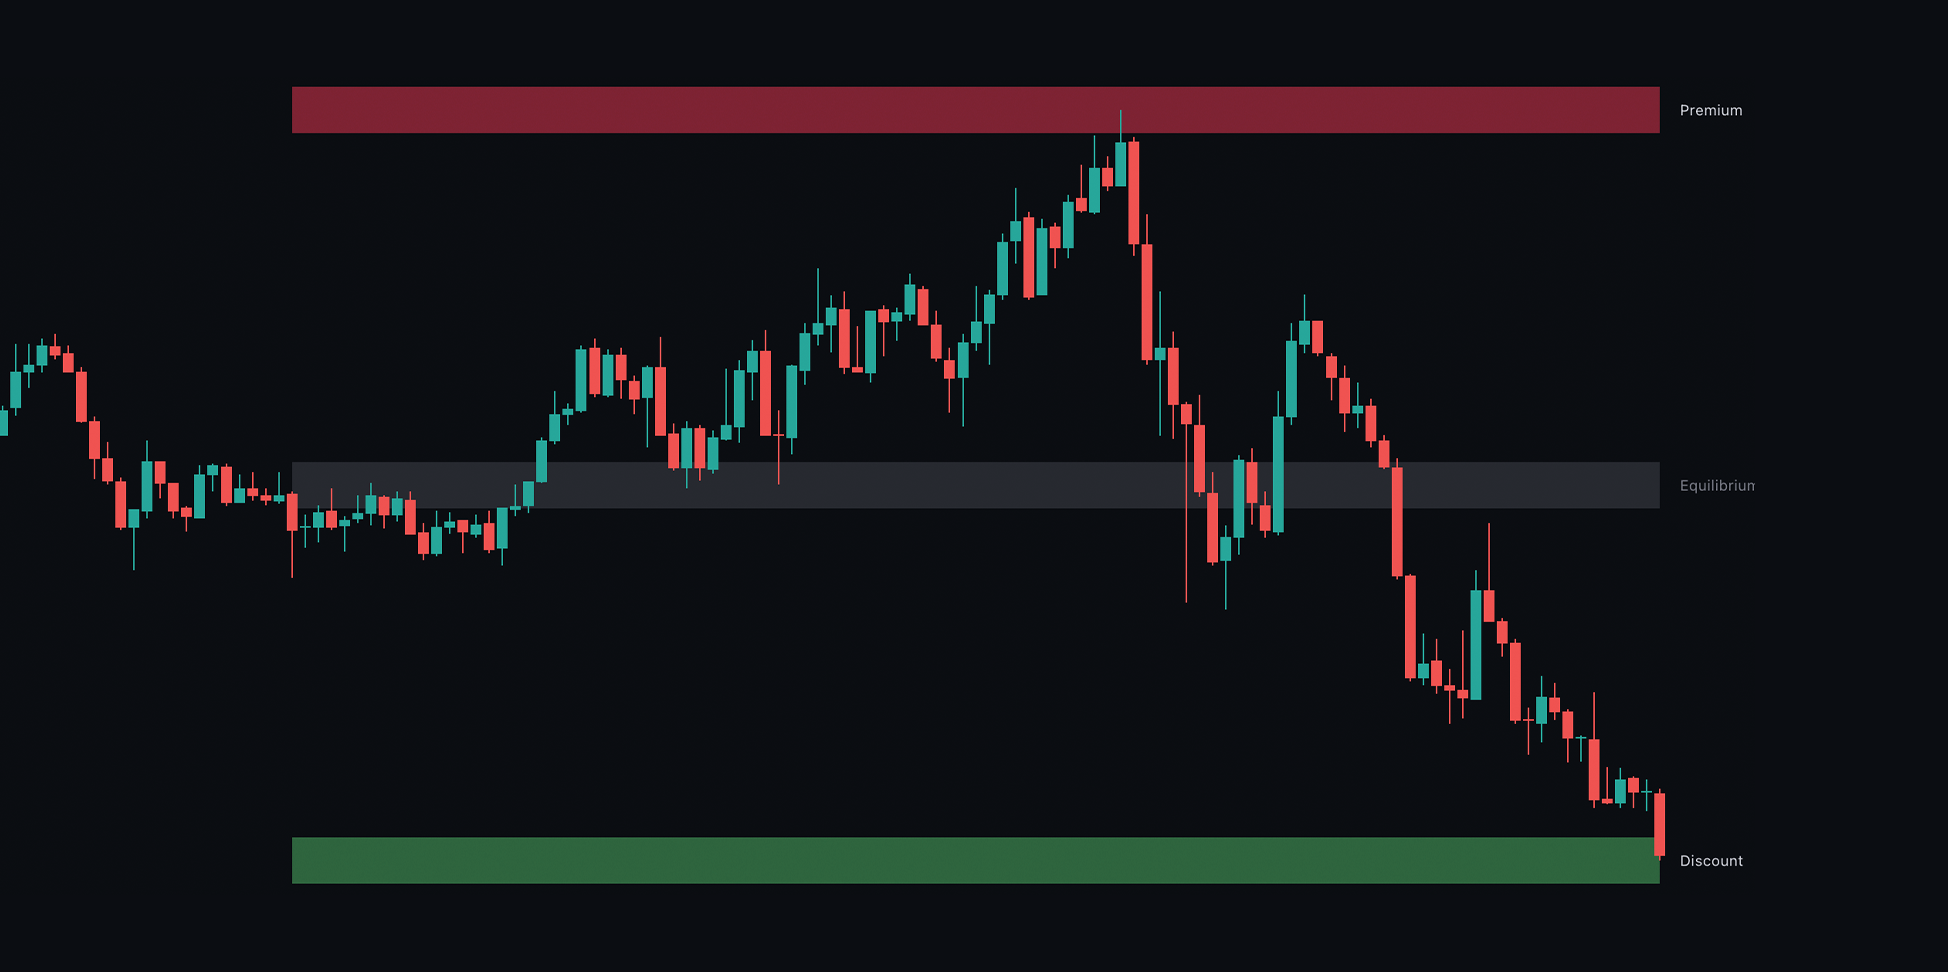
Premium and Discount Zones indicate swing point liquidity in a market. Once enabled, users will see three zones on their chart:
Discount Zone (Bottom): This area indicates where the asset is trading at a discount. Like purchasing an item at a lower price, this is a reasonable buying area due to supporting liquidity.
Equilibrium Zone (Middle): This zone represents the market’s balanced state, reflecting the fair normal value of the asset.
Premium Zone (Top): This area indicates where the asset is overvalued, suggesting a potential pullback. There is typically significant sell-side liquidity at this level.
 |
|---|
| Premium and Discount zones showing potential Support and Resistance areas |
Each zone can be utilized as a support or resistance level. Users can adjust the length to change the lookback period; a higher value analyzes more bars, resulting in a larger long-term premium and discount zone, while a lower value produces a smaller zone. Color customization is also available via the provided inputs.
A VWAP toggle is included in the volume profile settings, using the profile’s search window as the VWAP range. VWAPs are effective for identifying trends and serve as support and resistance in the market.
To learn how to use premium and discount zones, check out the tutorial below:
Fair Value Gaps (FVGs)
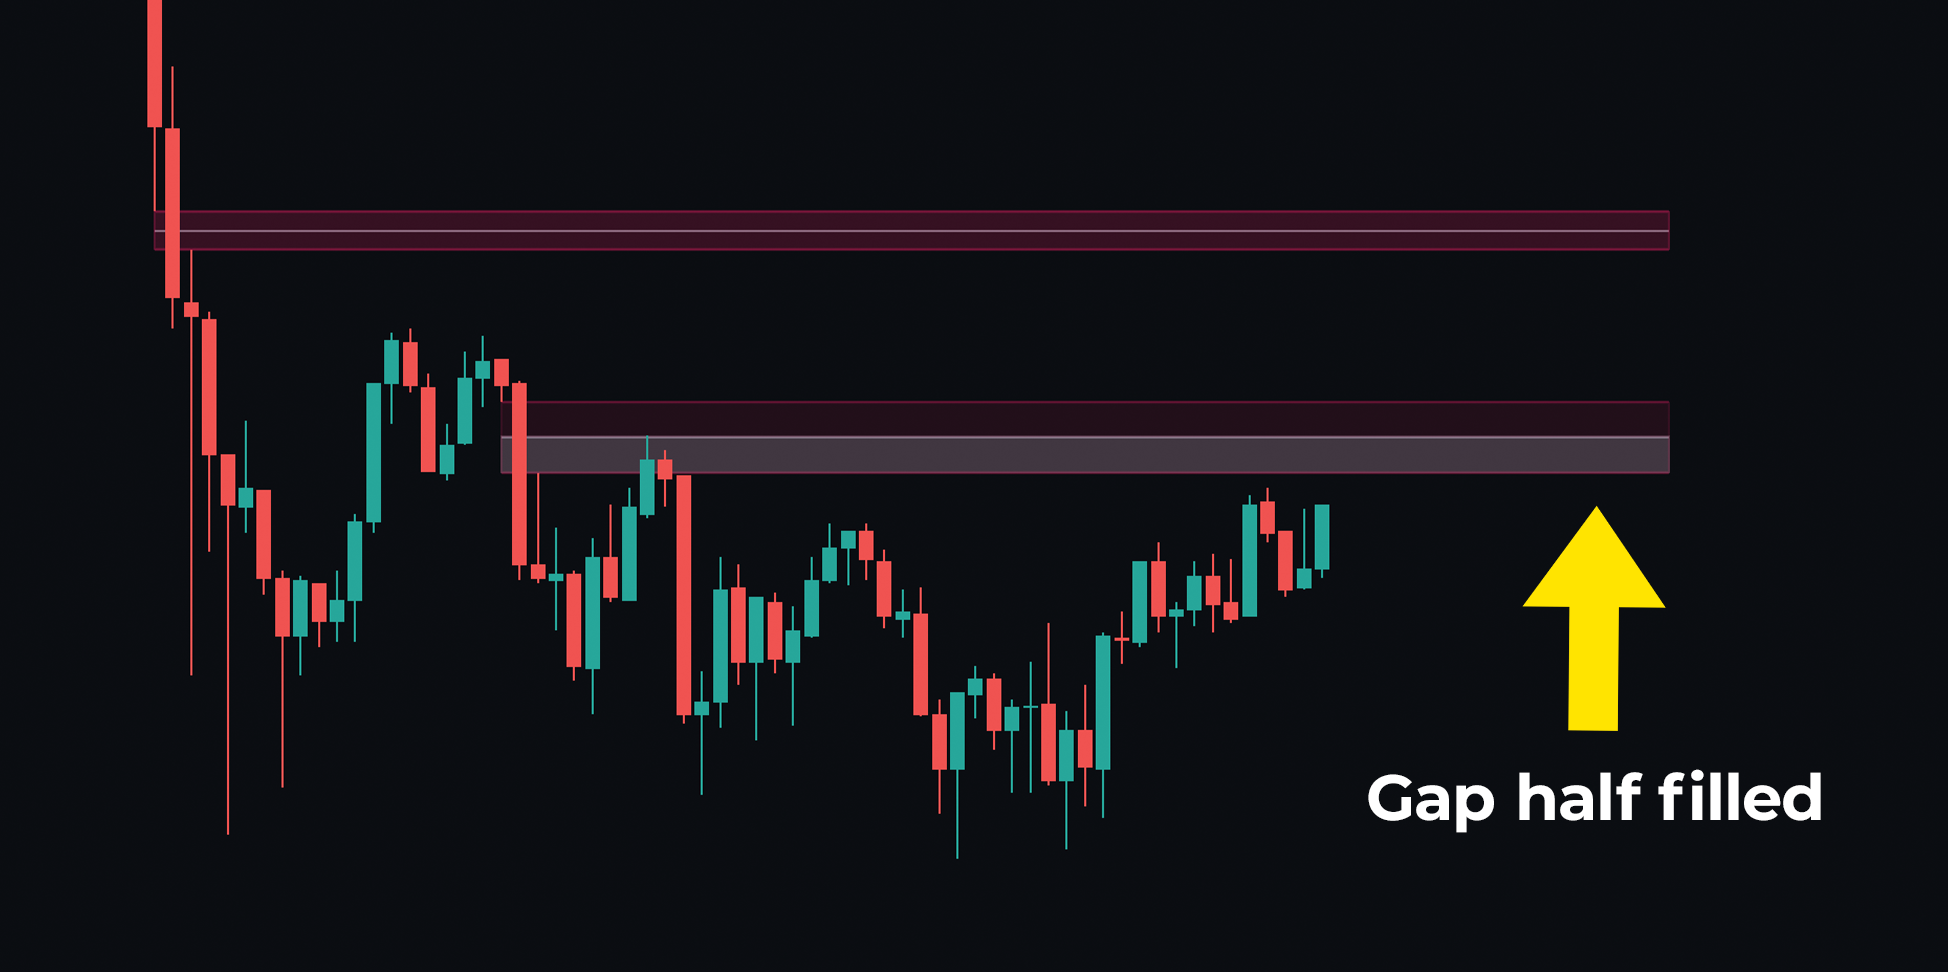
Fair Value Gaps are areas in the market where an imbalance has occurred. Technically, these gaps arise when the prior candle and the following candle do not overlap in the middle area of the bar, indicating that the market is no longer “fair.” These gaps act as magnets, drawing price towards them, and once filled, order is said to be restored in the market.
 |
|---|
| Fair Value Gaps showing the gaps left in market price action |
Market Dynamics allows traders to pull FVGs from various timeframes via the timeframe dropdown and extend the FVG zone for real-time trading forecasts. Using FVGs as potential take profit areas can be an excellent strategy, as price tends to gravitate towards them.
For more information and tutorials on FVGs, watch the video below:
FVGs also feature a fill, which reduces the gap as price enters it, providing a clear indication of the remaining area that needs to be filled.